Have you ever wondered what truly makes a wheel good? And how can a wheel builder track his work consistency over time? In this article, I’ll share findings from around 1,800 saved tensioning files, highlight common quality standards achieved across builds, and introduce performance indicators to track and measure wheel quality.
Main purpose? Providing a framework of performance metrics including common quality benchmark standards of wheel quality. This would help fellow builders better understand wheel quality evaluation and facilitate adopting a more data-driven approach to provide grounds for improvement.
But before we dive into the insights, let me share a few opening thoughts.
Disclaimer: If you’re wondering why this article on evaluating performance is so extensive, performance measurement is not new to me. In fact, it was the focus of my master’s thesis during my postgraduate studies in economics.
TABLE OF CONTENTS
Due to extensive scope of the analysis performed in the article, here is a table of contents for easier navigation. Enjoy!
- KEY TAKEAWAYS
- Why a metrics-based approach matters
- Setting up a new standard in wheel building
- Benchmark for wheel building quality
- The challenges of a data-driven approach
- THE DATASET
- The Tension Lab - a page, devoted to quality
- A note on designing metrics
- RESULTS AND DISCUSSION
- Spoke balance index
- The Quality Score, a metric to rule them all
- Distribution overview
- Accuracy Index (AI)
- Tension variabilty (TVI)
- Range Consistency Score (RCS)
- Stress Index (SI)
- Meeting targets
- Spoke Efficiency Index (SEI)
- Precision chart
- PUTTING IT ALL TOGETHER
- Radar chart
- FUTURE IMPLICATIONS AND NEXT STEPS
- FINAL THOUGHTS
KEY TAKEAWAYS
Exploring such an extensive dataset amazed me as it revealed clear patterns and benchmarks that can establish a foundation for quality in wheel building. Here are some highlights.
Why a metrics-based approach matters
“Measure what you want to improve.” Relying solely on experience and intuition can often lead to inconsistent results, especially in a professional setting where every wheel counts. By adopting a metrics-driven approach, builders gain a deeper understanding of the quality and consistency of their work and have actionable insights to improve it gradually.
It turns out that such an approach also provides a practical way of communicating and sharing results, including those of customers. Imagine being able to hand over a simple yet comprehensive report showcasing easy-to-understand metrics that prove the reliability of their wheel. This level of transparency builds trust and transcends the overall added value of handcraft.
Setting up a new standard in wheel building
By sharing findings, I hope to inspire builders to embrace data as a tool for achieving higher standards. Wheel building will always remain a craft, but by deploying some data-derived metrics it can also become a science. Insights from this dataset present a step forward toward a more scientific, data-driven wheel building.
Benchmark for wheel building quality
To identify benchmarks of quality, I developed metrics inspired by statistical principles to track and measure wheel-building standards with the aim to:
- Provide a clearer and less ambiguous way to evaluate build quality,
- Identify specific areas for improvement, and
- Monitor long-term trends and consistency.
Data-derived metrics offer insights into the uniformity of spoke tension, the rate at which target tensions are achieved, patterns in tension distribution and a lot more. By quantifying variability of spoke tension rather than relying on estimates, they establish a clear framework for assessing current and improving long-term work consistency.
While I’ll touch on some of these indicators throughout the findings, a full list of the metrics is provided at the end of the article for reference.
The challenges of a data-driven approach
As appealing as such approach may sound, striving for perfect scores on these metrics can feel excessive in a busy workshop environment or even blurs a broader picture of what you are trying to achieve. It’s easy to get caught up, especially when poor-quality components make ideal results difficult to achieve.
In wheel building, we more or less manage imperfections. And ironically, the goal isn’t perfection — it’s progress. Focus on the indicators that align with your workflow and professional setup, and use them to track improvements in quality and consistency over time.

Note: Assessing wheel quality through tension variability metrics is just one dimension of delivering a high-quality product. When combined with minimal trueness imperfections and carefully selected components, only then we speak of achieving a top-notch level of professional service.
THE DATASET
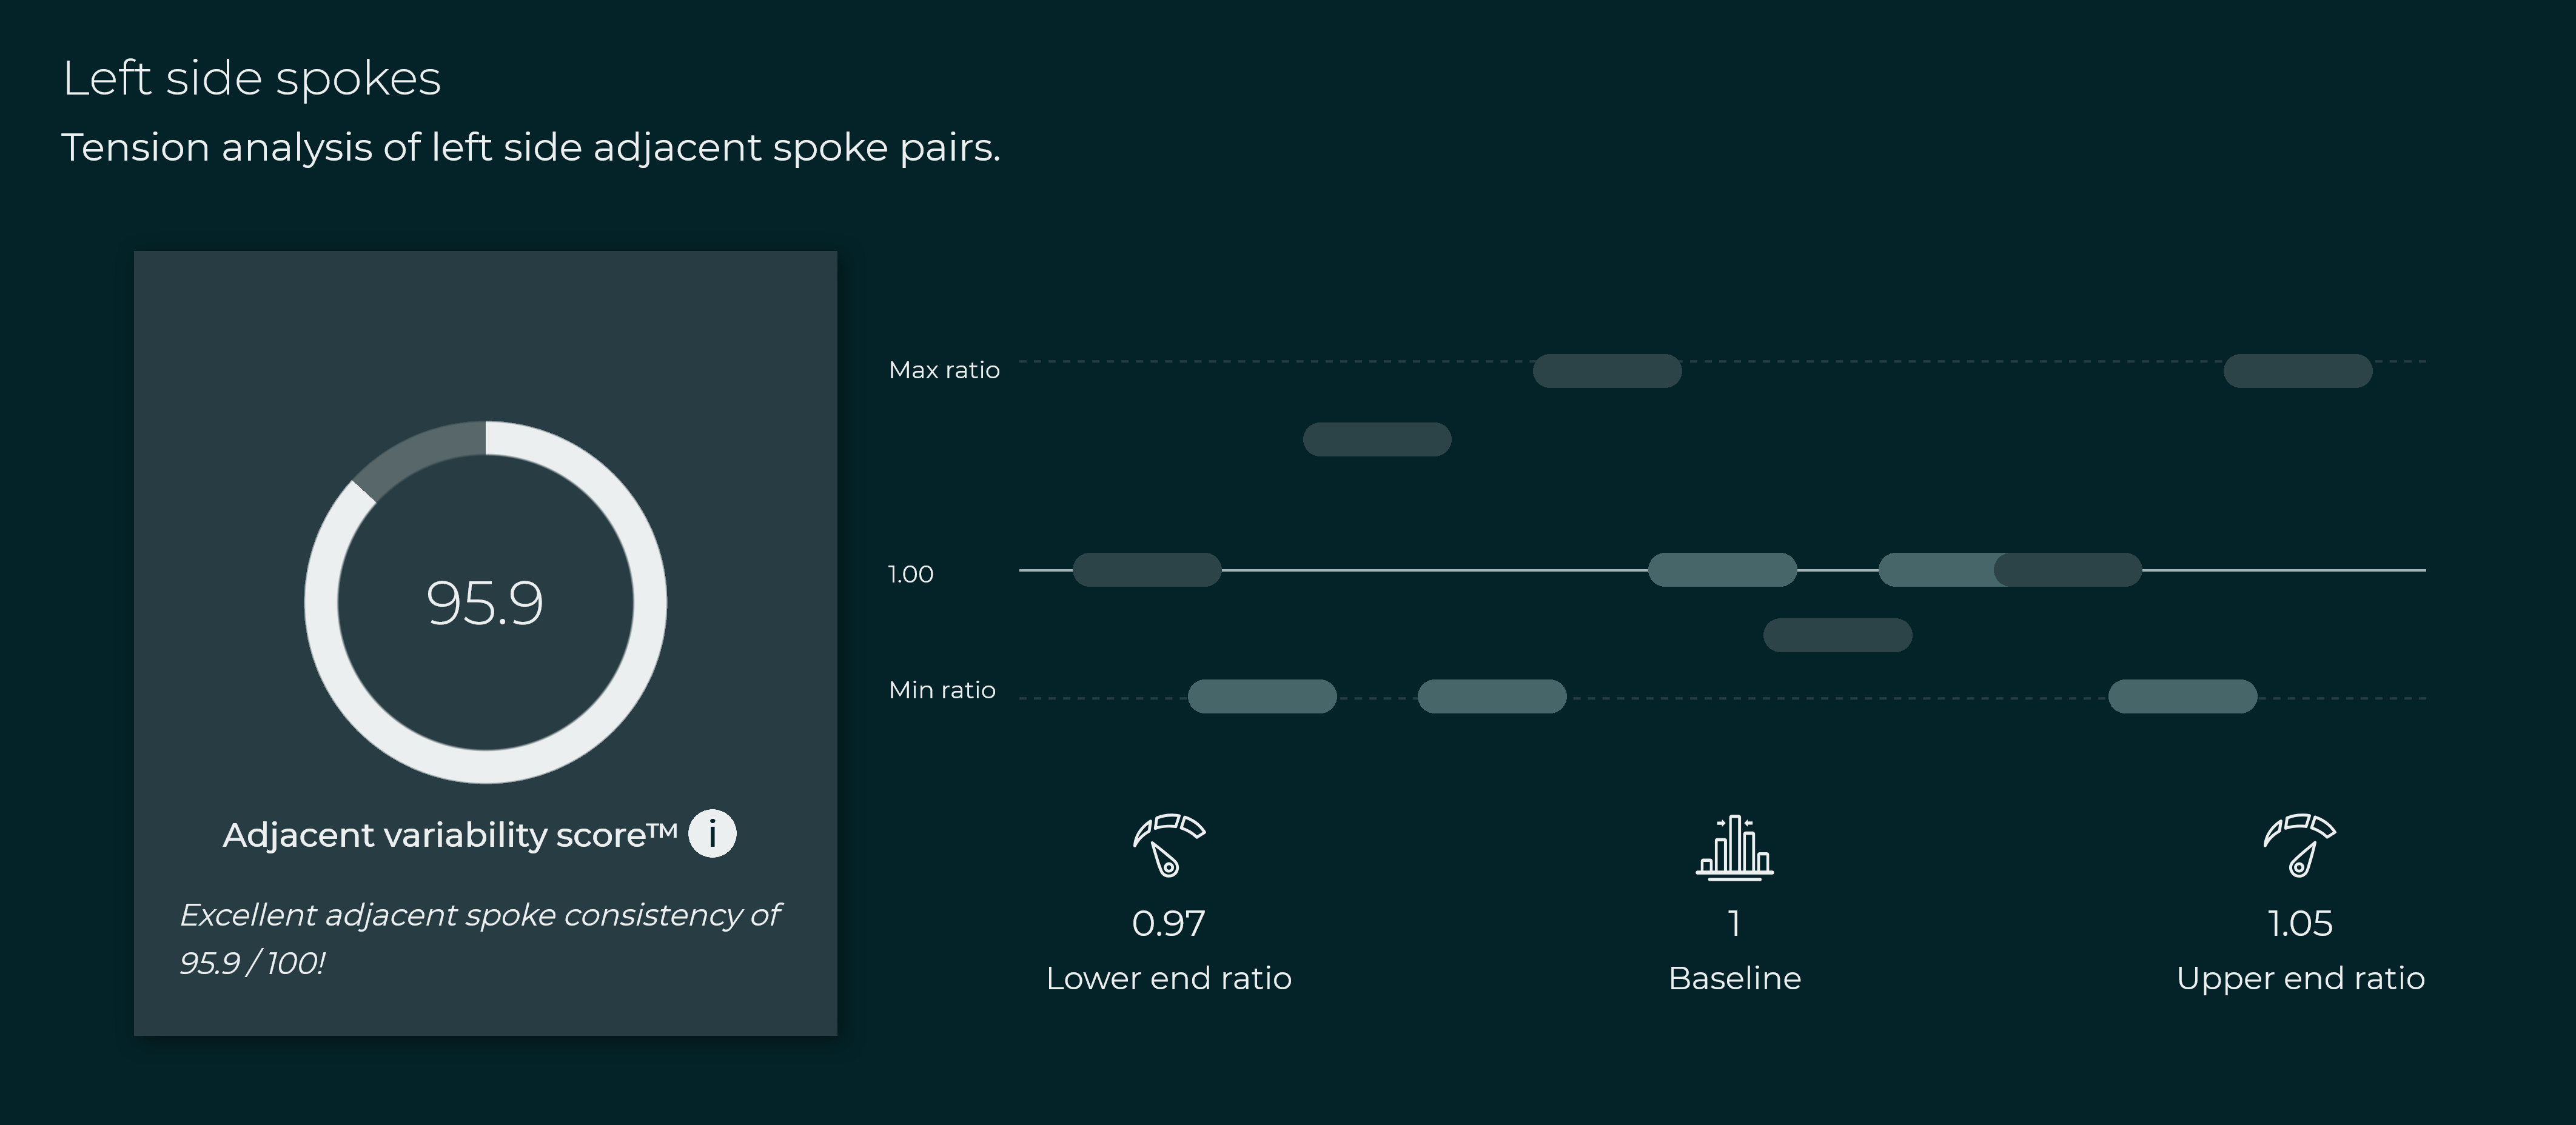
The Tension Lab - a page, devoted to quality
As mentioned, the current dataset, sourced from my database, includes just under 2,000 wheels, with front and rear wheels almost equally represented in the sample, as shown in the stats cards below.
Since the drive and non-drive side tension readings are stored as separate rows, the data allows for side-specific analysis where applicable, providing deeper insights into the current state of wheel building.
Note: To the app members, the current data including interpretation is available on the Tension Lab page inside the App Spokecalc website.
A note on designing metrics
Trying to cover different aspects of build quality, just a quick memo on the precision vs accuracy. Precision refers to how closely grouped or consistent the tensions are relative to each other. If most spokes fall within a narrow range of deviation, the build is considered precise, as it shows uniformity and minimal variation. On the other hand, accuracy would measure how close the average tension is to the target tension.

Next thing, when designing metrics for wheel building quality, intuitively, the common factor used to normalize data would be the target spoke tension value. However, as preliminary insights have shown me, it seems target tension is a rather elusive term.
While target tension is typically derived from the rim's maximum allowable tension on the dominant tension side, the non-dominant tension side is more complex, as it’s mathematically derived rather than directly specified and can differ in a real life setup. This variability often introduces inconsistencies when using target tension as a reference point for accuracy.
To address this, I opted to avoid the reliance on target tension wherever possible. Instead, I incorporated average tension into calculations, providing a more stable and uniform baseline for quality assessment.
Last but not least, relying on a single metric can be limiting and may not capture the full complexity of wheel build quality. While each metric provides valuable insights, they are most helpful when used alongside others. This approach ensures a more comprehensive evaluation while staying aware of the limitations inherent in any single measure.
RESULTS AND DISCUSSION
Spoke balance index
Although not a direct measure of wheel quality, the Spoke Balance Index (SBI) provides a valuable insight into the common spoke tension balances between the drive side (DS) and non-drive side (NDS) of wheels analyzed.
On average, the analysis revealed that front wheels have an SBI of 0.89, indicating that the left side is in most cases the dominant one while right side spoke tension comes at 89 %. Rear wheels, on the other hand, revealed the opposite trend, with an SBI of 1.49, reflecting significantly more tension put on the drive side.
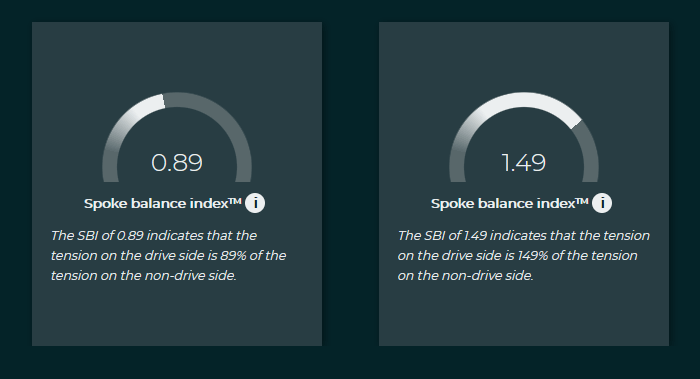
The SBI metric is relatively straightforward: it uses a baseline of 1.00 to represent perfectly symmetrical builds, making it an intuitive way to compare how component geometries—such as hub flange spacing or rim design—impact overall tension balance and wheel structure.
While not a standalone quality metric, the SBI’s role is more as an illustrative tool, helping builders visualize and better understand how component choices influence the structural balance of a wheel.
The Quality Score, a metric to rule them all
After exploring different aspects of wheel tensioning, I wanted to design a single metric to represent overall build quality. This led to the Quality Score, which measures how consistent spoke tensions are within a wheel.
The Quality Score is designed to compare the variation in spoke tensions to the average tension. A lower variation therefore results in a higher score, with values ranging from 0 to 100. Moreover, a quality score close to 100 should indicate better tension consistency. Since it’s normalized using the average tension, the score can be compared across different builds.
From the sample analyzed, the overall Quality Score for the front wheels was on average 87.3 while rear wheels on average scored slightly higher at 88.2.

Breaking it down further, rear wheels tended to have more balanced spoke tensions across both sides, suggesting builders may achieve slightly better consistency in rear wheels compared to front wheels.
The Quality Score should provide builders with a simple way to track and improve their work. By aiming for higher scores over time, it’s easier to spot trends and make adjustments. It also provides a clear way to show clients the quality of their wheels.
DISTRIBUTION OVERVIEW
Whenever exploring distribution in general, the most common statistical metrics include the mean value and the range, defined by the minimum and maximum spoke tensions in our case. These metrics provide an essential foundation for understanding how spoke tensions vary across wheel builds.
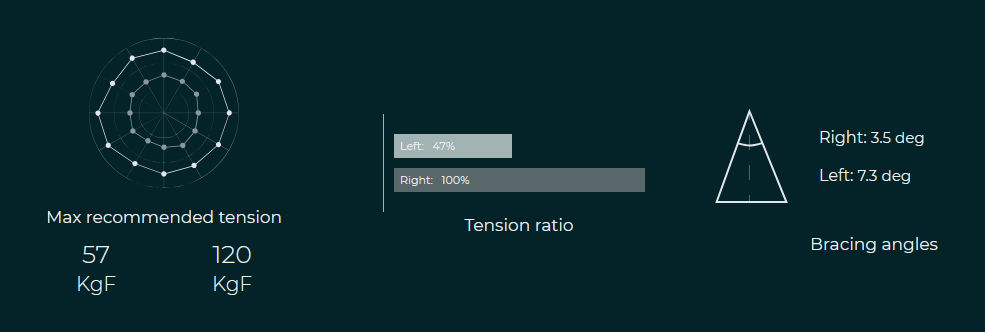
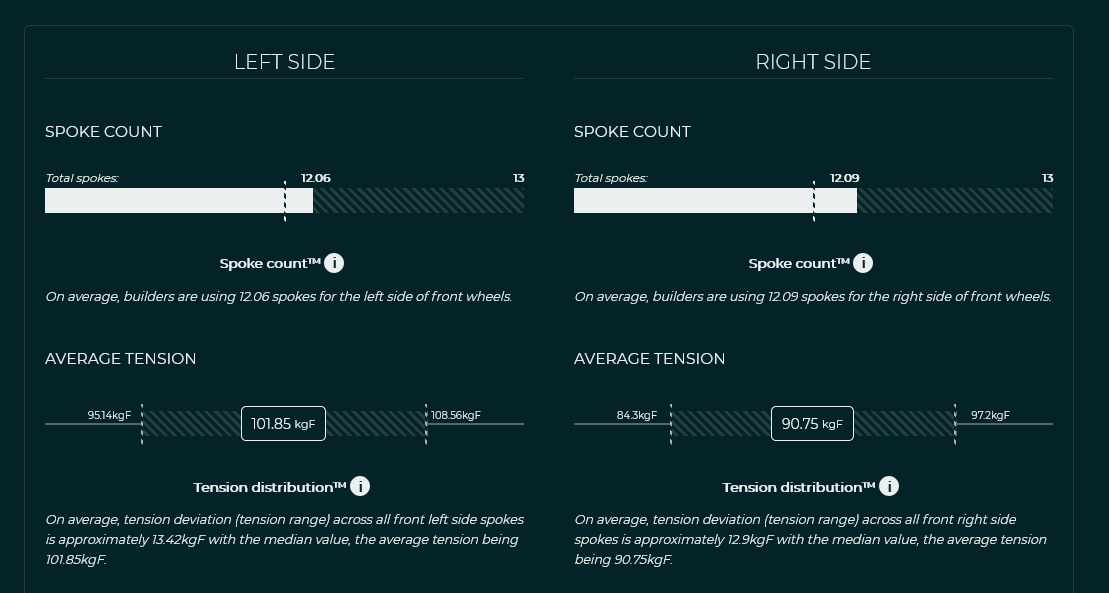
For front wheels, the average spoke tension was 101.85 kgF on the left side and 90.75 kgF on the right side. The average tension spread was 13.46 kgF, slightly higher on the side with greater tension. This spread corresponds to average minimum and maximum spoke tensions of 95.01 kgF and 108.47 kgF, respectively.
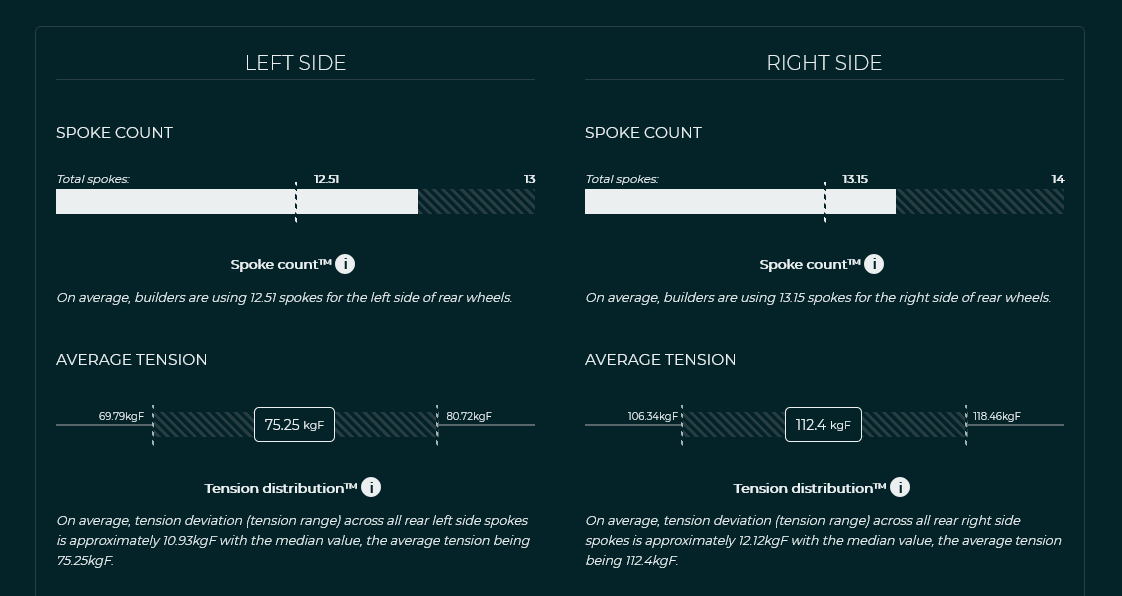
In the case of rear wheels, the average spoke tension was 75.25 kgF for the non-drive side and 112.4 kgF for the drive side. Interestingly, the absolute spoke tension ranges were somewhat smaller. On average, the tension spread for the non-drive side spanned 10.93 kgF around the mean, while the drive side showed a slightly higher spread of 12.12 kgF.
These insights reveal subtle yet important differences in tension distribution between front and rear wheels, offering a quantitative perspective on how wheel geometry and build practices affect spoke tensions.
ACCURACY
Accuracy index (AI)
Now that we have a better sense of tension variation, to what degree are targets being met? The Accuracy Index (AI) tracks how closely the achieved average spoke tension aligns with the set target tension. It is calculated as the ratio of the average recorded tension to the target tension.
An Accuracy Index of 1.00 represents a perfect match, where the average spoke tension exactly meets the target. Ratios above or below 1.00 indicate slight over- or under-tensioning, respectively.
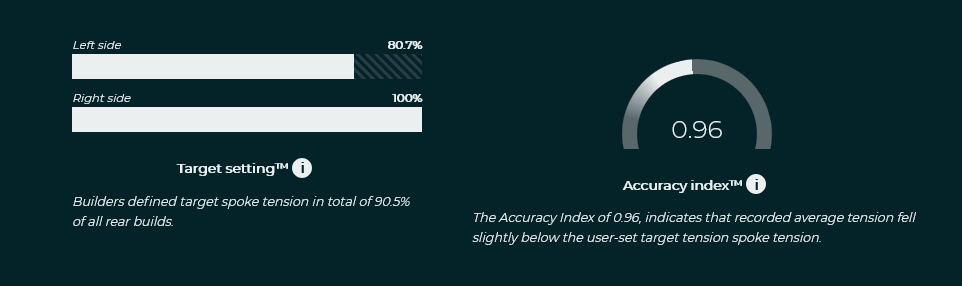
When averaged across both wheel sides, front and rear, results show a slight tendency towards under-tensioning, with an index value of 0.97. This suggests builders exercise caution to avoid exceeding the maximum allowable tension.
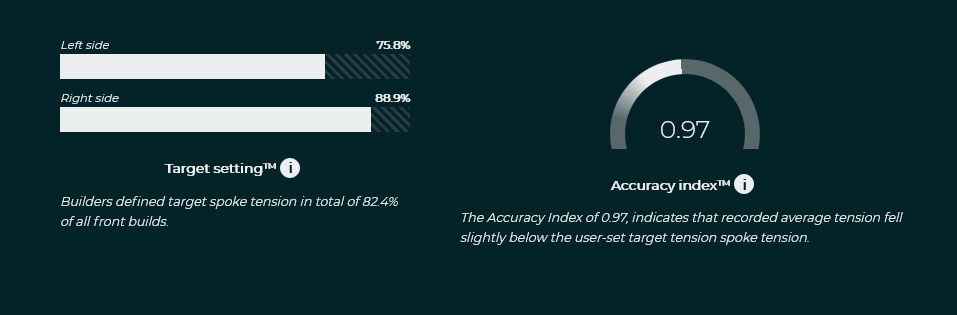
But do builders always set a target tension before tensioning a wheel? It turns out they do in most cases:
- 82.3% of front wheels have a predefined target tension.
- The rate is even higher for rear wheels, with 90.9% of builds having set targets on average.
Even though target setting appears to be a standard practice for the majority of builds, it is still not applied to all builds. Reasons for it were suggested above in the section "A note on designing metrics".
Note: The dominant tension side is typically determined by the maximum allowable spoke tension, while the non-dominant side is derived from calculations (e.g., spoke calculations). However, real-life setups can introduce deviations. As a result, the accuracy index for the non-dominant side may not always perfectly align with the set target tension. Another reason hides in already built wheels where we do not know geometry of the build to the point to calculate tension ratios accurately.
VARIABILITY MEASURES
Tension variability – the consistency measure of spoke tensions
Returning to the topic of distribution, how spread out are the values? While we’ve already discussed absolute averages and ranges, these alone cannot provide a basis for comparing multiple builds. Nor do they signal if the dataset exhibits low dispersion - where values cluster tightly around the center - or if the values deviate significantly from the mean.
From a statistical standpoint, a universally comparable metric to assess variability is the Coefficient of Variation (CV). Calculated as the ratio of the standard deviation to the mean tension, CV offers a statistical measure of spread. It highlights how much variance exists in the dataset or how evenly spoke tensions are distributed. A larger spread may indicate inconsistencies in wheel build quality.
To make this concept practical and relatable to wheel building, the CV was rebranded as the Tension Variability Index (TVI). This metric is ideal for comparing datasets with different mean values (e.g., different sides of the wheel) or even across different units (e.g., kgF vs. Nm).
The results are as follows:
- A TVI calculated for front wheels was 3.35% for the left side and 3.91% for the right side.
- Rear wheels TVI came at 3.95% for the left side and 3.26% for the right side.
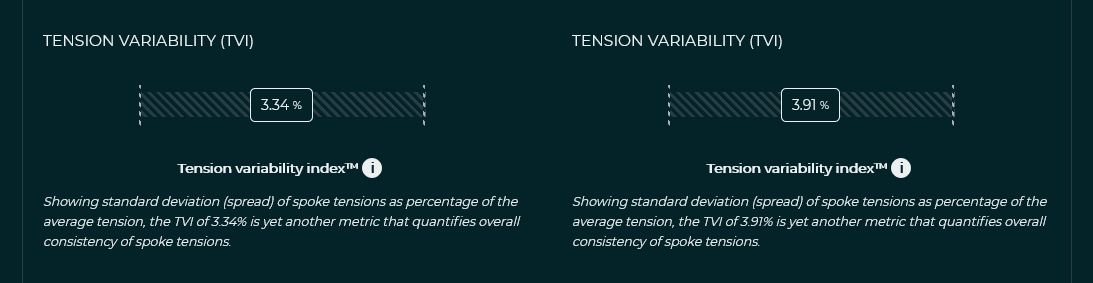
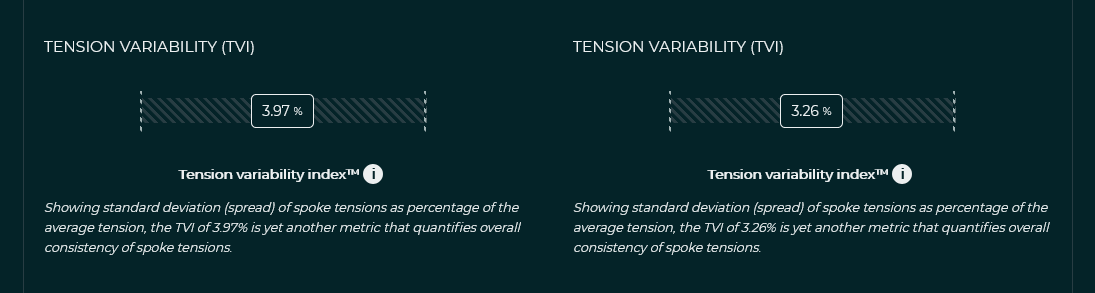
Interestingly, the dominant tension side (the right side for most rear wheels and the left side in case of front wheels) tended to exhibit greater consistency, as indicated by lower TVI values. This suggests that builders put more attention to the dominant side, resulting in higher degree of spoke tensions uniformity on these sides.
However, because CV (or TVI) might be harder to interpret or less intuitive for practical use, two additional measures were deployed to directly observe consistency in spoke tensions - Range Consistency Score and Stress Index.
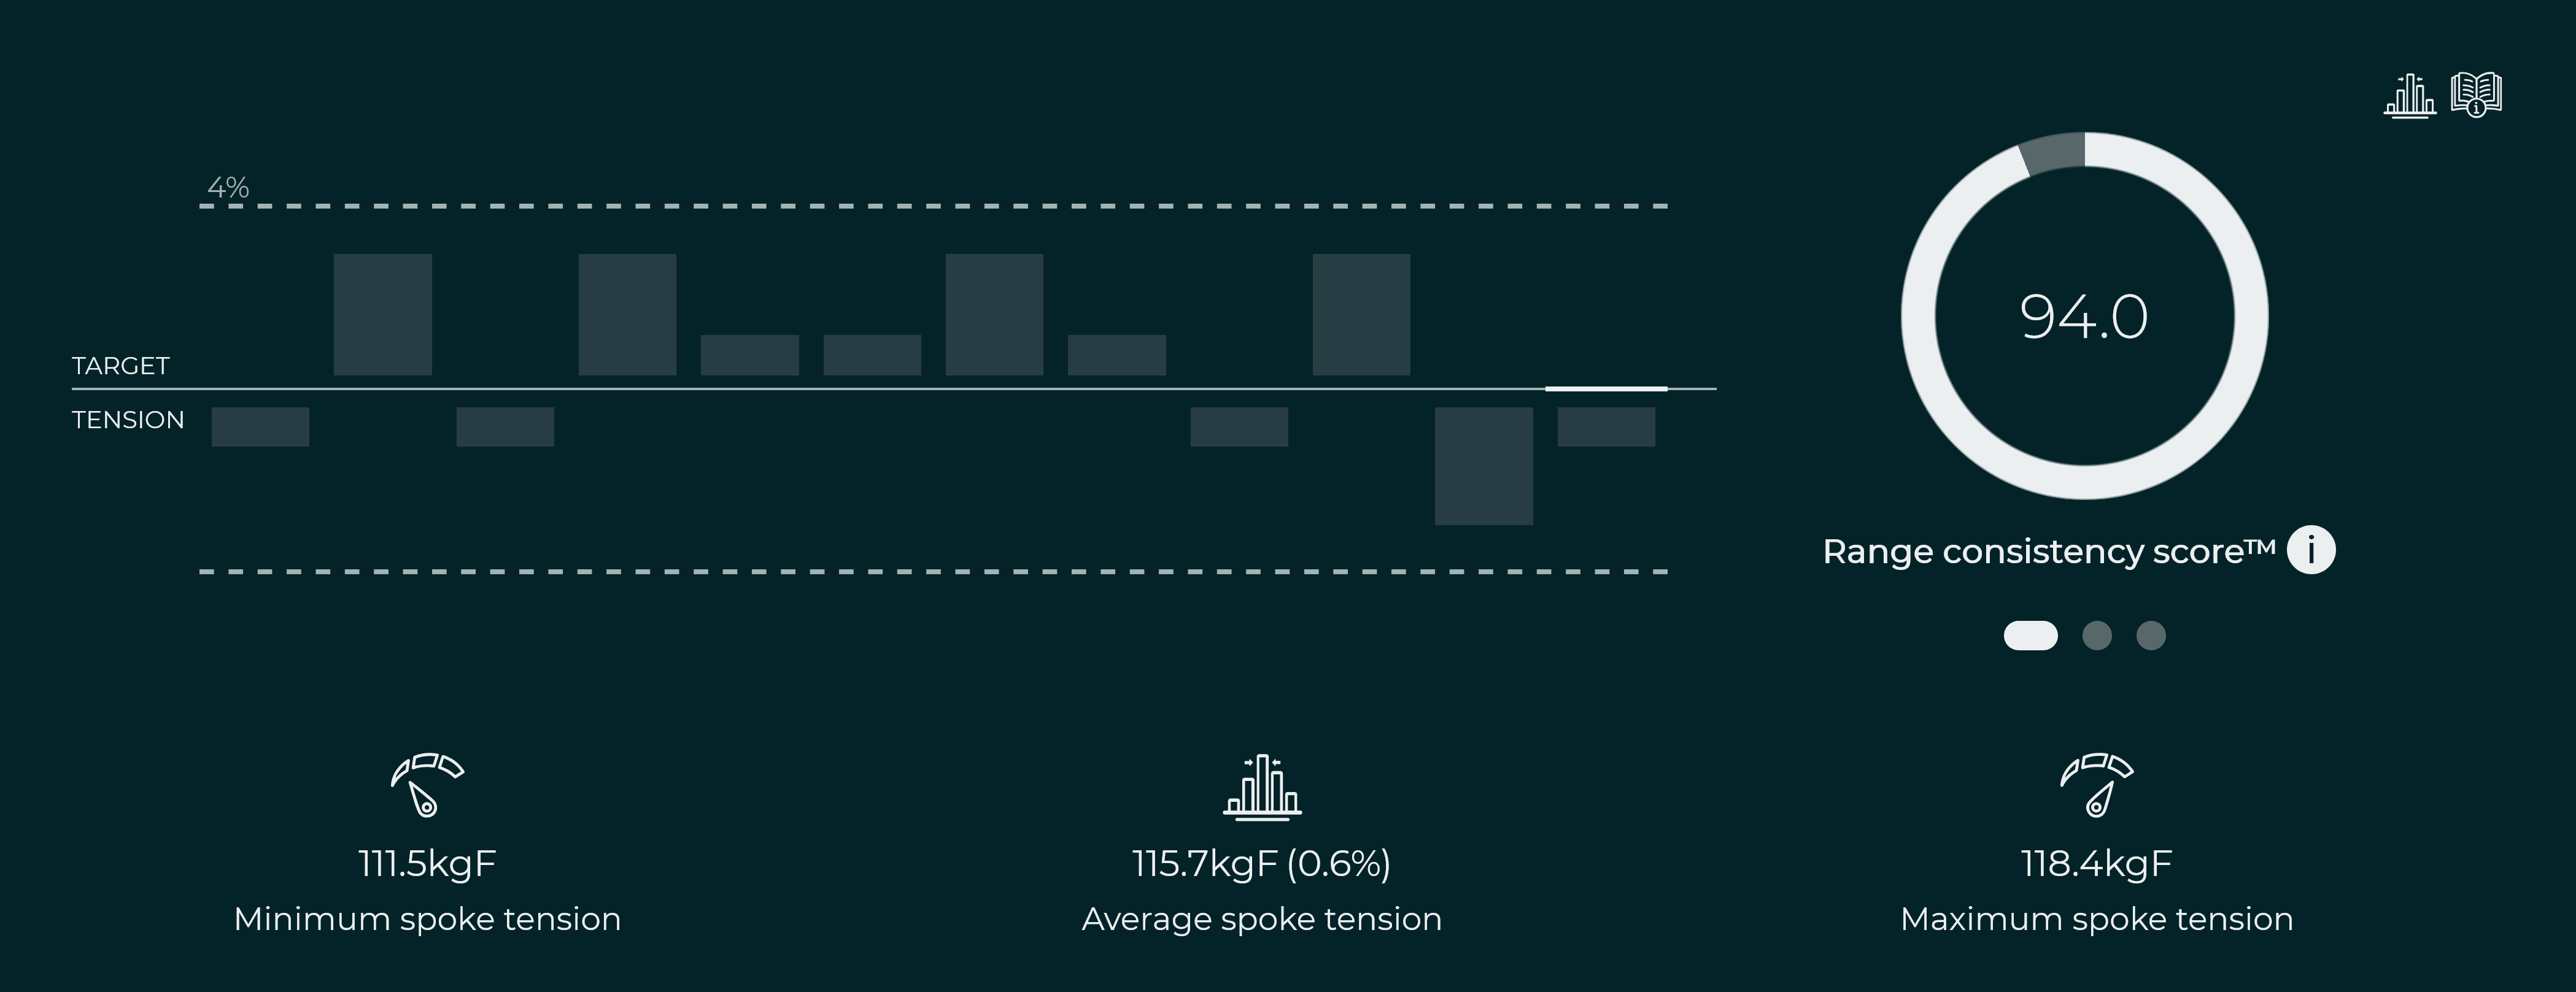
Range Consistency Score (RCS)
The Range Consistency Score (RCS) offers a practical way to evaluate how closely spoke tensions are grouped around the average value. It does so by comparing the spread of values — calculated as the range (difference between the maximum and minimum tensions) — against the average tension:
This metric is straightforward to interpret. A higher spoke tension range signifies greater deviation within the dataset, thereby lowering the score and signalling less consistency. Since the result is scaled from 1 to 100, the RCS is comparable across multiple wheel builds.
Higher RCS values indicate better spoke tension consistency (lower range relative to the average), while lower RCS values highlight greater variability in spoke tensions, suggesting less uniformity. However, it’s important to note the limitations of this indicator: while it assesses uniformity based on the range defined by upper and lower boundaries, spoke tensions within this range can still be unevenly distributed.
As a reference point, these are RCS results from all the wheels inside the Tension app.
- Front wheels scored an average of 86.3.
- Rear wheels scored slightly higher at 87.3.
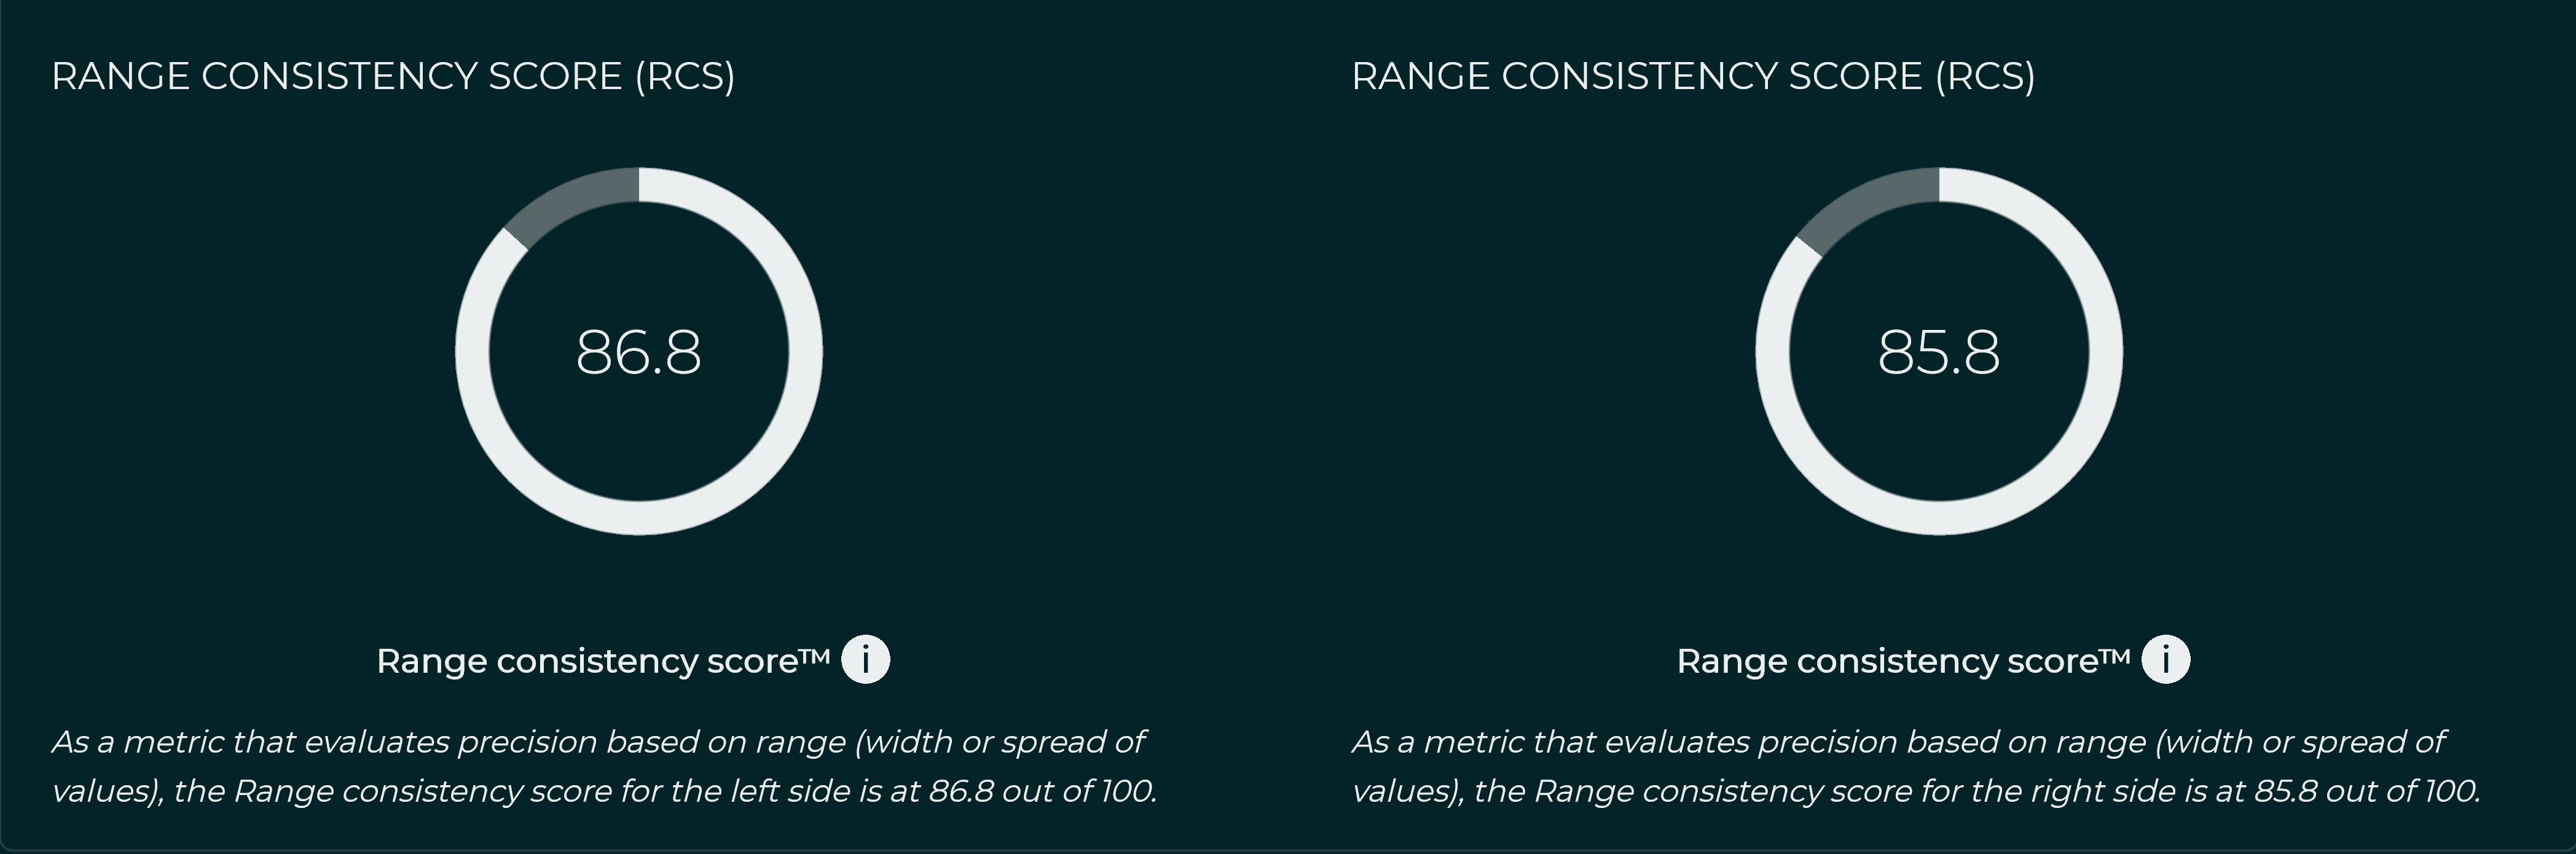
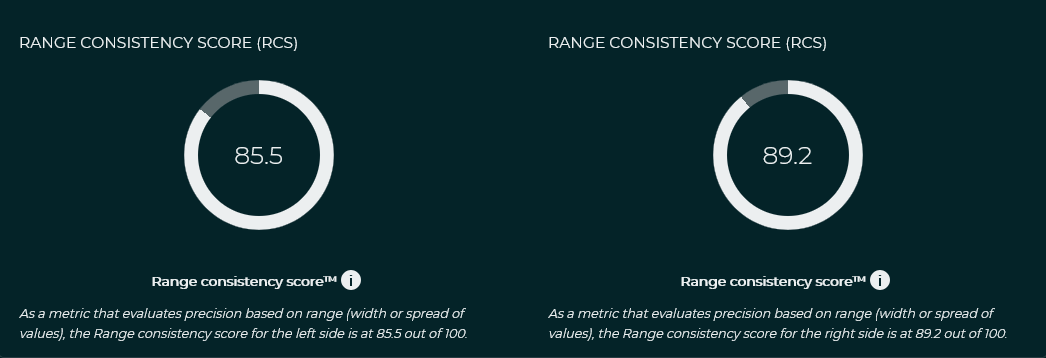
Judging spoke tension uniformity by range span (which this metric is based on), rear wheels in general perform slightly better by this indicator.
Note: While the RCS is excellent for assessing the precision and uniformity of spoke tensions within a wheel, it doesn’t address how closely the achieved tensions align with the target tension (accuracy). For a comprehensive evaluation, it’s best to use the RCS in combination with the Accuracy Index (AI), described earlier.
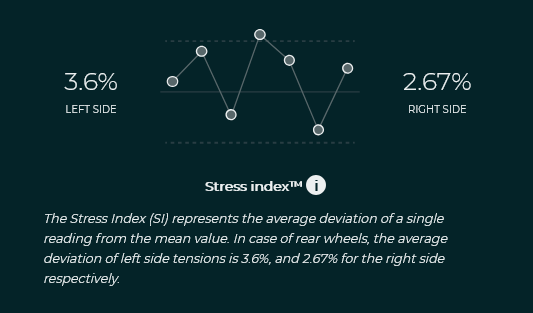
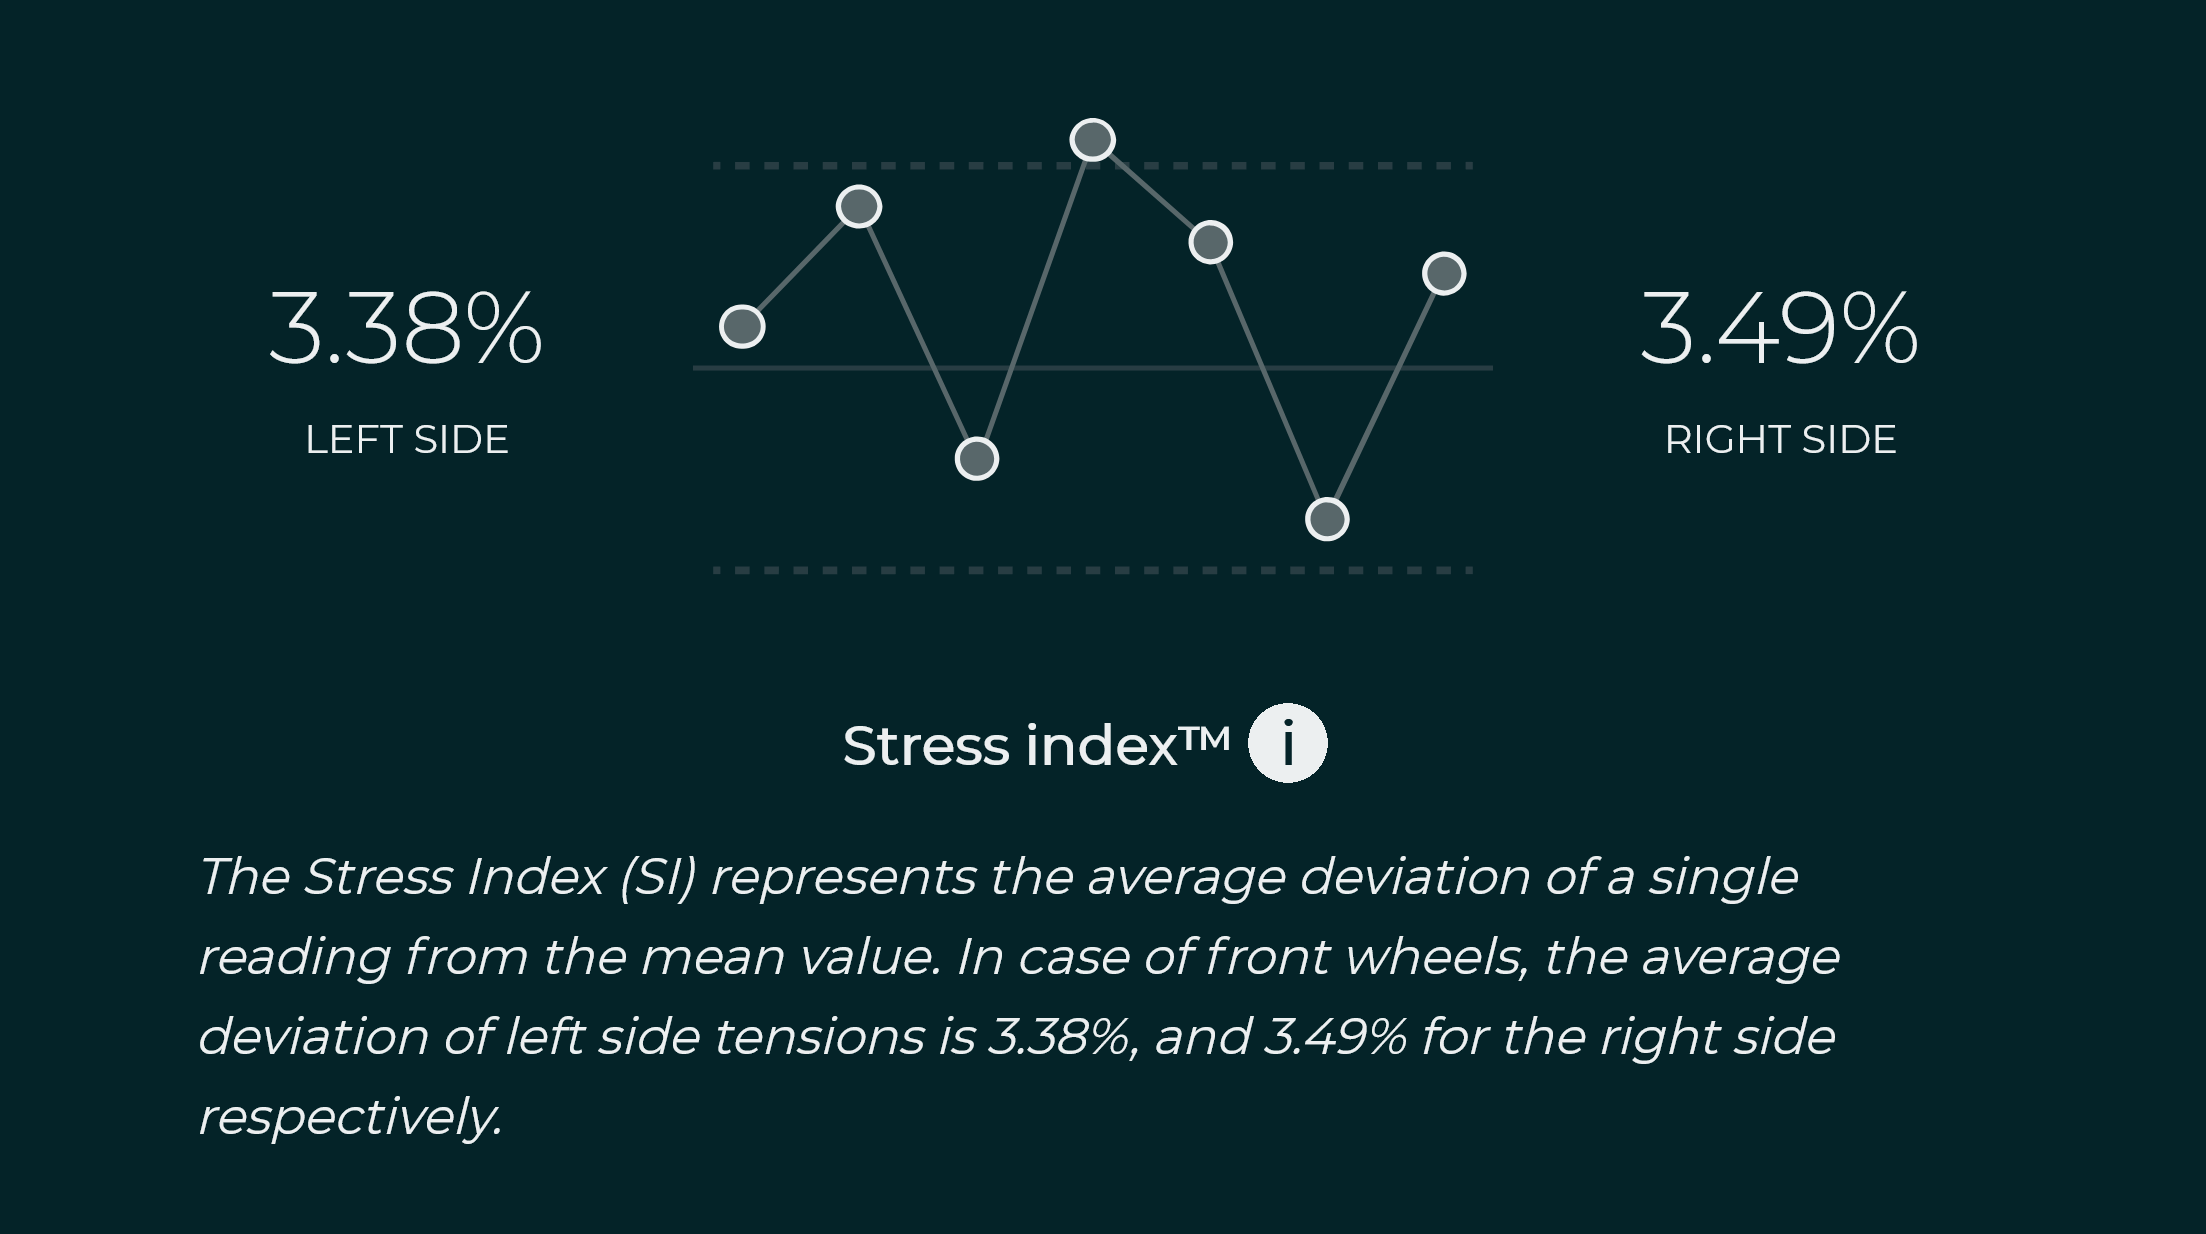
Stress Index (SI)
The Stress Index (SI) is likely the easiest and most practical live metric to use during the wheel tensioning process. Many builders are familiar with calculating percentage deviations of individual spoke tension readings from a baseline, such as the target or average tension. The Stress Index formalizes this approach, providing a straightforward evaluation of precision in relative terms.
This metric tracks how evenly stress (or strain) is distributed among the spokes by measuring the deviation of each spoke's tension from its respective side's average tension (used as a pseudo "target"). The inclusion of "stress" in its name reflects its role in highlighting how well strain is distributed across the wheel.
Observing variations in strain enables builders to spot and correct inconsistencies early in the tensioning process. But what were actual results in this aspect inside the app?
Rear wheels: the overall average Stress Index was 3.11%, with the right side scoring significantly better at 2.65% compared to the left side at 3.58%. This suggests builders focused more on precision for the dominant (drive) side.
Front wheels: at first glance, front wheels showed a slightly higher overall deviation with an SI of 3.44%. However, a closer look revealed near-equal performance between the sides, with the left side at 3.39% and the right side close behind at 3.49%.
PRECISION
Meeting targets
Knowing the Accuracy Index, let’s rewind a bit and explore builders’ expectations going into the builds. Understanding their acceptable standards is key to evaluating their success in achieving them.
The acceptable upper and lower tolerances, defined as the tension limits that acted as boundaries or the percent range of the desired spread, were 5.82% for front wheels and 6.01% for rear wheels.
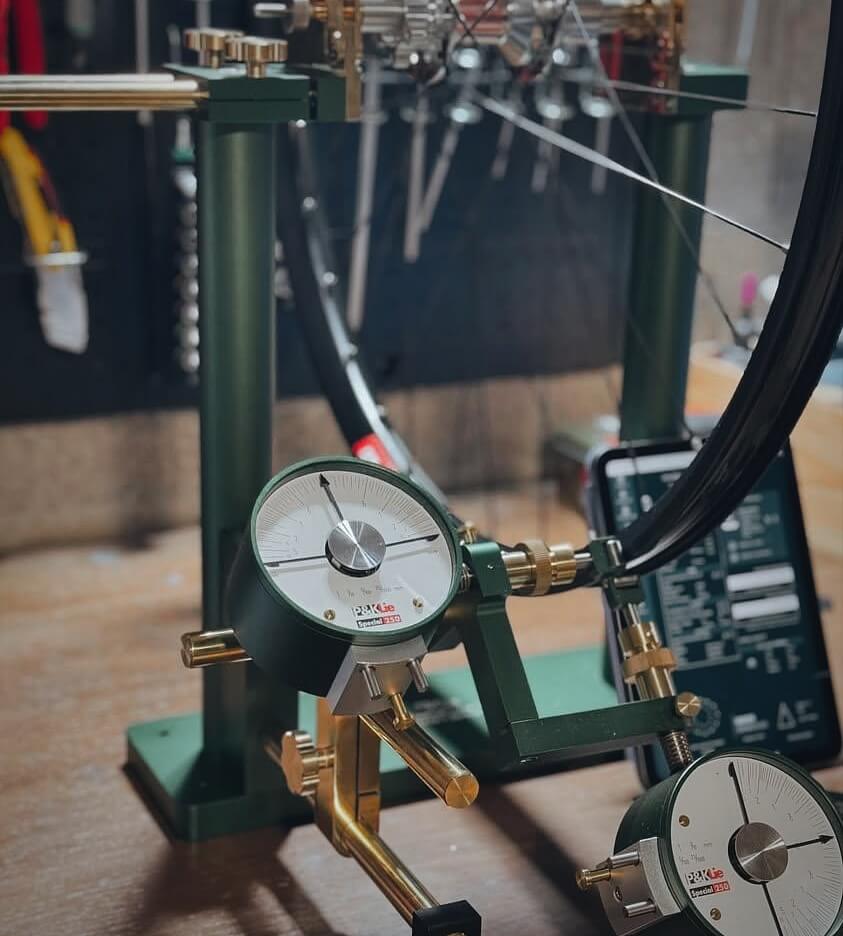
Once a builder selects tension limits prior to tensioning, they are then displayed on a bar chart in a form of dashed lines to visually define upper and lower boundaries of acceptable tension.
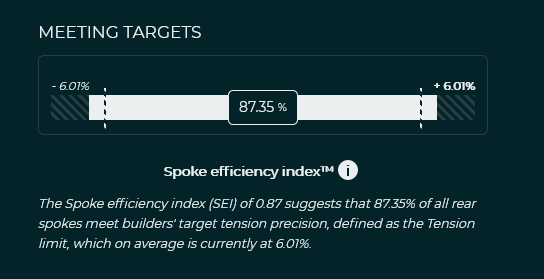
Spoke Efficiency Index (SEI)
The Spoke Efficiency Index (SEI) measures the percentage of spokes that fall within these predefined acceptable tension limits, which act as benchmarks for precision during wheel tensioning. These limits are often visualized as dashed lines on bar charts, delineating the upper and lower boundaries of tension deviations.
While these limits provide a useful guideline, they are somewhat subjective, depending on the builder’s preferences and the accuracy of their tension meter.
So, how precise are the builders within the app?
The SEI of 0.83 indicates that 83.29% of all front spokes stayed within the acceptable tension limits of +/- 5.82%.

The SEI of 0.87 for rear wheels on the other hand shows that 87.49% of rear spokes met the target of +/- 6.01% limit.
Knowing the SEI will give us a broad view over the tension spread while the next indicator, the Precision Chart, really takes it a step further as it provides even deeper insight into precision achieved across individual builds.
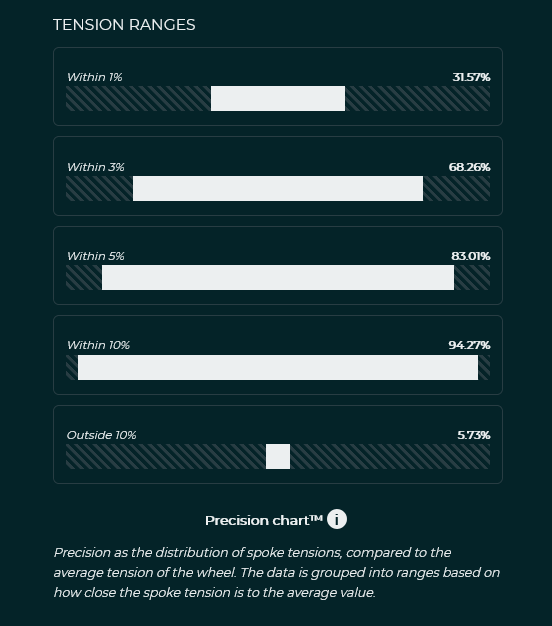
Precision chart
The Precision Chart is intended to visualize the spread of spoke tensions across a wheel build in an organized and measurable way. By grouping individual spoke tensions into ranges based on their proximity to the mean value, the chart provides a clear benchmark of quality levels achieved throughout builds.
Starting the analysis by setting the boundaries at +/- 10% of the average spoke tension, results reveal well over 90% of spokes fall within this range. Unsurprisingly, the proportion of spoke scattered outside this boundary is relatively small: 7.75% for front wheels and 5.62% for rear wheels.
Slowly we start to narrow down our tolerances. Interestingly, the majority of remaining spoke tensions lie within the +/- 5% range. In fact, almost 80% of spokes on front wheels and 83.2% on rear wheels fall into this range. This is also the range that coincides with acceptable tension limits set prior to tensioning the wheels, mentioned above. But what happens next?

We then actually observe a somehow non-linear nature of the drop-off as tolerances tighten further. Between 65-70% of all spoke tensions remain within the ±3% range, showing a slower rate of decline in precision. Based on spoke percentage, this should be our golden range.
Lastly, we have the range of +/- 1% of the average tension, presenting cutting-edge levels of precision. Here, the proportion of spokes meeting this incredibly tight standard is actually half of the the one inside the previous range, but still scoring almost 32% for both front and rear wheels. Impressive!
PUTTING IT ALL TOGETHER
Radar chart
Probably the most meaningful and broadly understood tension visualization tool in the wheel-building trade is the Radar Chart. By helping to detect outliers, explore tensioning symmetry patterns, and assess the alignment of each side to the baseline, it consistently proves to be a helpful and intuitive tool for builders.
Now that we’ve uncovered patterns and quality levels of wheel building achieved inside the SpokeCalc App, what does the template radar chart, based on averages of individual spoke tensions, look like?


Note: For front wheels, a 12-spoke count was selected, while the chart represents 14 spokes for rear wheels to better reflect typical layouts.
FUTURE IMPLICATIONS AND NEXT STEPS
Having uncovered quality benchmarks and introduced performance indicators to measure wheel quality and track consistency, what are the next steps?
The existing queries within the database on the Tension Lab page already provide app members with the current state of quality and evolving trends. It will be interesting to observe how these trends develop over time and whether having clear measures to track quality translates into long-term improvements in the consistency of builders' workflows.

Introduced metrics also have significant potential to evolve further, to be even better tailored to specific aspects of wheel building.
It seems like all steps naturally lead toward deeper exploration as the article provided me ideas for expanding the topic into a series of deeper analyses. While I won’t reveal too much, part two will most likely focus on the latest major update to the Tension App. This includes integrating the performance metrics described here to offer builders live scores, as well as the new approach of spoke tension ratio analysis.
Last but not least, another exciting direction would be to highlight the app's best-performing wheels or top builders. Closer look to their techniques and tensioning patterns could potentially uncover cutting-edge approaches in the trade.
FINAL THOUGHTS
“Measure what you want to improve”. Knowing what makes your work good is the first step toward mastering the craft. By focusing on specific aspects of quality, you can identify areas for improvement and steadily grow as a builder. Whether you choose to adopt quality indicators as a live tool during the wheel tensioning process or as a way to track long-term consistency trends, the choice is yours.
While it may seem overwhelming or impractical to keep track of multiple metrics at first, starting small can make a big difference. Gradually adopting a few indicators that you fully understand and feel comfortable using will help you improve steadily over time without adding unnecessary complexity to your workflow.
Your customers will notice the difference, too. Providing wheels backed by a data-driven approach reflects your commitment to quality. There’s something undeniably powerful about knowing the wheel they receive came from a builder with a proven history of precision and care.
By embracing these insights and tools, you’re not just building wheels — you’re building trust, consistency, and a reputation!
Enjoy wheel building!
Enjoyed this article?
Buy me a coffee to support my work!
Every coffee helps fuel more content like this!
About author

Aljaž Trenta
Author and founder"As a cycling enthusiast, bike mechanic and self-taught web designer, combining several of my passions and skills to build SpokeCalc was a great fun for me."